Zero order methods
Zero order methods
Implement Rastrigin function f: \mathbb{R}^d \to \mathbb{R} for d = 10. link
f(\mathbf{x})=10 d+\sum_{i=1}^{d}\left[x_{i}^{2}-10 \cos \left(2 \pi x_{i}\right)\right]
- Consider global optimization from here.
- Plot 4 graphs for different d from {10, 100, 1000, 10000}. On each graph you are to plot f from N_{fev} for 5 methods:
basinhopping,brute,differential_evolution,shgo,dual_annealingfrom scipy, where N_{fev} - the number of function evaluations. This information is usually available fromspecific_optimizer.nfev. If you will need bounds for the optimizer, use x_i \in [-5, 5]. - Note, that it is crucial to fix seed and to use the same starting point for fair comparison.
Machine learning models often have hyperparameters. To choose optimal one between them one can use GridSearch or RandomSearch. But these algorithms computationally uneffective and don’t use any sort of information about type of optimized function. To overcome this problem one can use bayesian optimization. Using this method we optimize our model by sequentially chosing points based on prior information about function.
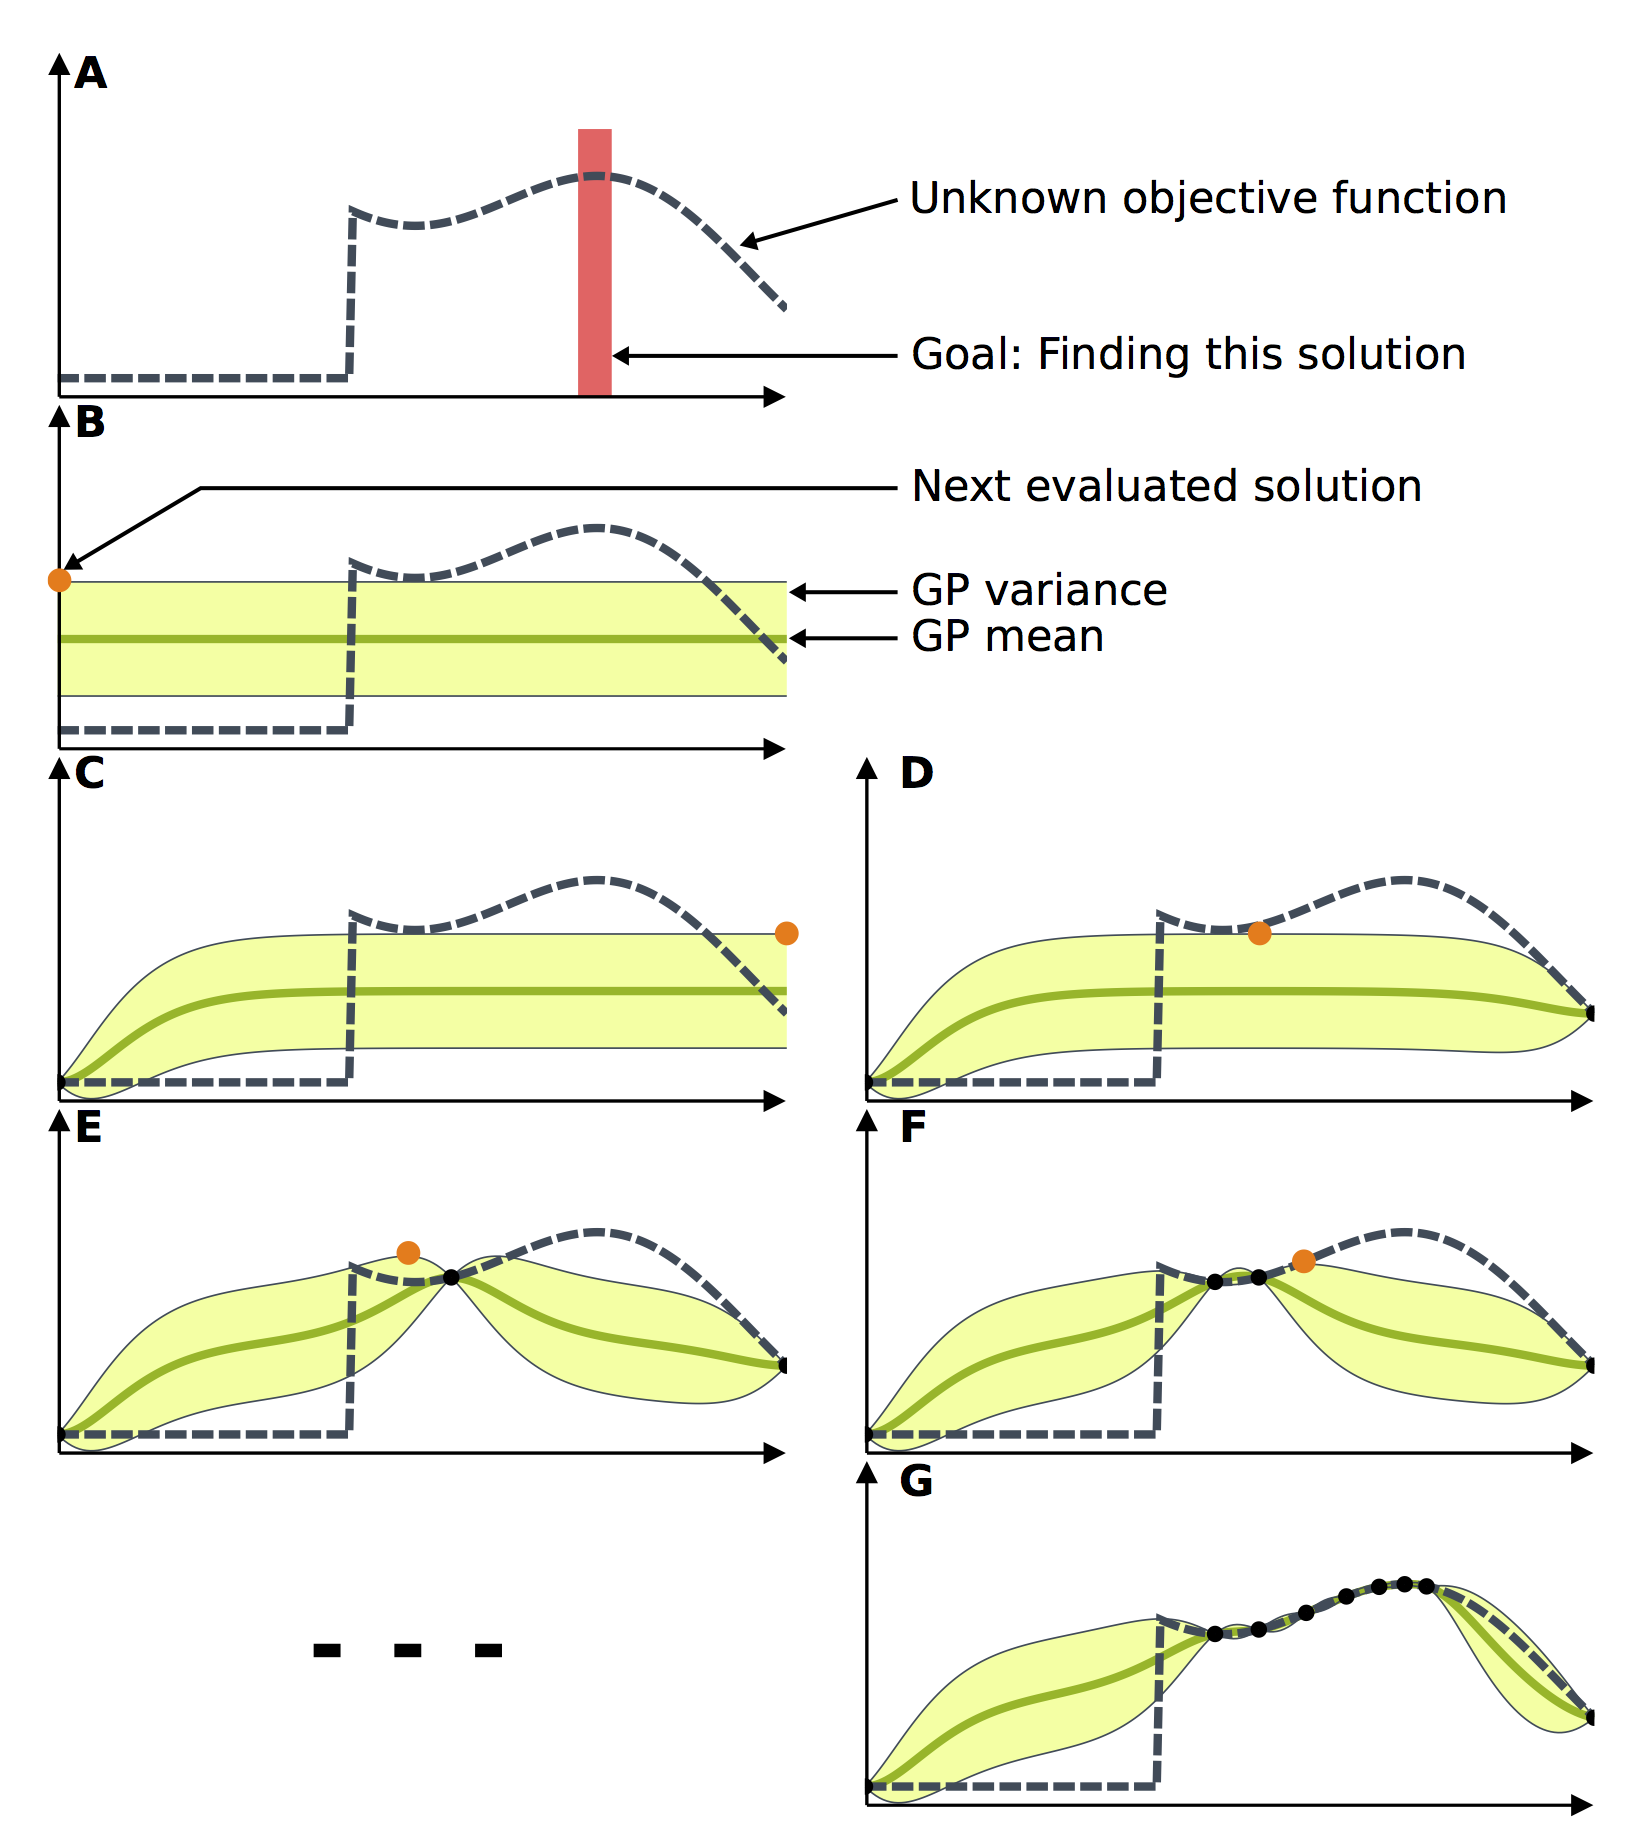
Image In this task you will use optuna package for hyperparameter optimization RandomForestClassifier. Your task is to find best Random Forest model varying at least 3 hyperparameters on iris dataset. Examples can be find here or here
!pip install optunaimport sklearn.datasets import sklearn.ensemble import sklearn.model_selection import sklearn.svm import optuna iris = sklearn.datasets.load_iris() x, y = iris.data, iris.targetTry to perform hyperparameter optimization in context of any metric for imbalanced classification problem with optuna and keras. Open In Colab{: .btn }
Let’s arrange the base stations of the wireless network optimally! Suppose you have N_{obj} = 10 clusters of 10 subscribers each. Let us use a genetic algorithm to gradually search for the optimal number and location of base stations in order to minimize the cost of arranging such stations.
Below is one possible implementation of the genetic algorithm.
Population
This is a list of arrays of size
[N_stations x 2]. Each individual in this case is a set of station coordinates on the plane. Generation of a randomMutation
Defined by the function
mutation(). Amutation_ratepart is selected from all individuals and a random Gaussian noise is added to themutation_ratepart of its stations. An individual with a random number of stations with random coordinates is then added to the population.Crossing
Defined by
children_creation()andbreed(). Two sets of stations are matched with a third station, from which the even stations of one parent and the odd stations of the other are taken.Estimation of the value of an individual
Defined by
evaluate_generation(). The total cost corresponding to a particular individual is made up of the cost of building base stations (each coststation_cost) minus the profit from each client. The profit from each client is inversely proportional to the distance to “his” base station. Each customer joins only one (closest) base station usingfind_nearest_station(). In addition, the profit from each subscriber is inversely proportional to the number of subscribers at a given base station (each station has the number of subscribersstations_loadconnected to it). Note also that, starting from a certain proximity to the subscriber to the base station, the client’s profit ceases to grow (in our algorithm, it is the same in the radius of0.1from the base station, then linearly decreases).Your task is to come up with any modifications to the proposed procedures within the genetic algorithm so that the final quality of the algorithm is better. Suggest, describe, and test ideas for improving the algorithm.
%matplotlib notebook

import numpy as np
from scipy.spatial.distance import cdist
from random import shuffle, sample
from copy import deepcopy
import random
from plotly.subplots import make_subplots
import plotly.graph_objects as go
from IPython.display import clear_output
import matplotlib.pyplot as plt

def generate_problem(N_obj, N_abon_per_cluster):
    abonents = np.zeros((N_obj*N_abon_per_cluster,2))
    for i_obj in range(N_obj):
        center = np.random.random(2)
        cov    = np.random.random((2,2))*0.1
        cov    = cov @ cov.T
        xs, ys = np.random.multivariate_normal(center, cov, N_abon_per_cluster).T
        abonents[i_obj*N_abon_per_cluster:(i_obj+1)*N_abon_per_cluster, 0] = xs
        abonents[i_obj*N_abon_per_cluster:(i_obj+1)*N_abon_per_cluster, 1] = ys
    return abonents

def plot_problem(abonents):
    plt.figure(figsize=(10,6))
    plt.plot(abonents[:,0], abonents[:,1], 'go')
    plt.title('The village')
#     plt.savefig('bs_problem.svg')
    plt.show()

def random_solution(abonents, N_solutions = 100):
    x_min, x_max = abonents[:,0].min(), abonents[:,0].max()
    y_min, y_max = abonents[:,1].min(), abonents[:,1].max()
    population = []

    for i_sol in range(N_solutions):
        N_stations = int(np.random.random(1)[0]*10)+1
        stations = np.zeros((N_stations,2))
        stations[:,0], stations[:,1] = np.random.random(N_stations)*(x_max - x_min), np.random.random(N_stations)*(y_max - y_min)
        population.append(stations)
    return population

def find_nearest_station(dist_matrix):
    return np.argmin(dist_matrix, axis=1)

def pairwise_distance(abonents, stations):
    return cdist(abonents, stations)

def evaluate_generation(abonents, population, station_cost = 1, abonent_profit_base = 1):
    costs = []
    for creature in population:
        N_stations, N_users = len(creature), len(abonents)
        total_cost          = N_stations*station_cost
        dist_matrix         = pairwise_distance(abonents, creature)
        stations_assignment = find_nearest_station(dist_matrix)
        stations_load       = np.ones(N_stations)
        stations_load       = np.array([1/(sum(stations_assignment == i_st)+1) for i_st, st in enumerate(stations_load)])

        for i_ab, abonent in enumerate(abonents):
            dist_to_base = dist_matrix[i_ab, stations_assignment[i_ab]]
            total_cost  -= stations_load[stations_assignment[i_ab]]*abonent_profit_base/(max(0.1, dist_to_base))

        costs.append(total_cost)
    return np.array(costs)

def mutation(population, mutation_rate = 0.3):
    N_creatures = len(population)
    x_min, x_max = -1, 1
    y_min, y_max = -1, 1
    mutated_creatures = sample(range(N_creatures), int(mutation_rate*N_creatures))
    for i_mut in mutated_creatures:
        N_stations = len(population[i_mut])
        mutated_stations = sample(range(N_stations), int(mutation_rate*N_stations))
        for i_st_mut in mutated_stations:
            population[i_mut][i_st_mut] += np.random.normal(0, 0.01, 2)

    N_new_stations = max(1, int(random.random()*mutation_rate*N_creatures))
    for i in range(N_new_stations):
        new_stations = np.zeros((N_new_stations,2))
        new_stations[:,0], new_stations[:,1] = np.random.random(N_new_stations)*(x_max - x_min), np.random.random(N_new_stations)*(y_max - y_min)
        population.append(new_stations)
    return population

def children_creation(parent1, parent2):
    # whoisbatya
    batya = random.random() > 0.5
    if batya:
        child = np.concatenate((parent1[::2], parent2[1::2]))
    else:
        child = np.concatenate((parent1[1::2], parent2[::2]))
    return np.array(child)

def breed(population):
    new_population = deepcopy(population)
    random.shuffle(new_population)
    N_creatures = len(population)
    for i in range(N_creatures//2):
        children = children_creation(population[i], population[i+1])
        new_population.append(children)
    return new_population

def selection(abonents, population, offsprings = 10):
    scores = evaluate_generation(abonents, population)
    best = np.array(scores).argsort()[:offsprings].tolist()
    return [population[i_b] for i_b in best], population[best[0]]


def let_eat_bee(N_creatures, N_generations, N_obj = 10, N_abon_per_cluster = 10):
    abonents = generate_problem(N_obj, N_abon_per_cluster)

    costs_evolution = np.zeros((N_generations, N_creatures))
    population = random_solution(abonents, N_creatures)
    best_creatures = []
    for generation in range(N_generations):
        population                = mutation(population)
        population                = breed(population)
        population, best_creature = selection(abonents, population, N_creatures)
        best_creatures.append(best_creature)

        costs_evolution[generation, :] = evaluate_generation(abonents, population)

        # Plotting
        x_min, x_max = 0, 1
        y_min, y_max = 0,1
        cost_min  = [np.min(costs_evolution[i])  for i in range(generation)]
        cost_max  = [np.max(costs_evolution[i])  for i in range(generation)]
        cost_mean = [np.mean(costs_evolution[i]) for i in range(generation)]

        fig = make_subplots(rows=1, cols=2, subplot_titles=("Topology of the best solution", "Cost function"))
        fig.update_xaxes(title_text="x", range = [x_min,x_max],  row=1, col=1)
        fig.update_yaxes(title_text="y", range = [y_min,y_max], row=1, col=1)
        fig.update_yaxes(title_text="Total cost", row=1, col=2)
        fig.update_xaxes(title_text="Generation", row=1, col=2)

        fig.add_trace(
            go.Scatter(x=abonents[:, 0], y=abonents[:, 1], mode='markers', name='abonents',  marker=dict(size=5)),
            row=1, col=1
        )

        fig.add_trace(
            go.Scatter(x=best_creatures[generation][:, 0], y=best_creatures[generation][:, 1], mode='markers', name='stations', marker=dict(size=15)),
            row=1, col=1
        )

        fig.add_trace(
            go.Scatter(x = list(range(generation)), y = cost_min, name='best'),
            row=1, col=2
        )

        fig.add_trace(
            go.Scatter(x = list(range(generation)), y = cost_max, name='worst'),
            row=1, col=2
        )

        fig.add_trace(
            go.Scatter(x = list(range(generation)), y = cost_mean, name='mean'),
            row=1, col=2
        )

        clear_output(wait=True)
        fig.show()

    fig.write_html("test.html")
    return costs_evolution, abonents, best_creatures


costs_evolution, abonents, best_creatures = let_eat_bee(200, 200)